Annex II Quality assurance and quality control
The following protocol was devised to provide National Experts with a step-by-step guideline to perform a Quality Assurance (QA) and Quality Control (QC) of the 29 GSOCseq products that result from the proposed methodology.
The following protocol does not provide any guidance in terms of uncertainty estimation and validation. For more details and information on the estimation of uncertainties and potential map validation strategies please refer to Chapter 12.
Quality assurance and quality control consist of activities to ensure the quality of a particular result. Quality control is a reactive process that focuses on identifying defects and errors while quality assurance is a proactive approach aimed at preventing defects and errors. In the context of digital soil mapping, both processes are often interlinked. A QA is interlinked with a QC when it identifies defects and the QA remodels the process to eliminate the defects and prevent them from recurring (Chapman, 2005)(Figure 16.1).
Figure 16.1 Quality Assurance & Quality Control
Each step in the following protocol should be considered in order to detect and eliminate errors, address data inaccuracies and assess the output completeness.
Step 1 Check that 29 products have been labeled appropriately and are in the correct format
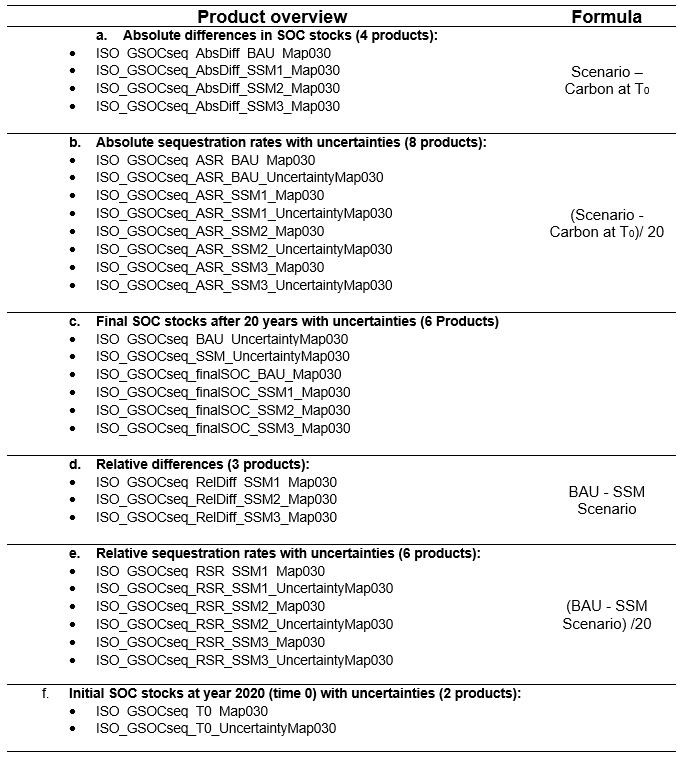
The following Table (Table 16.1) gives an overview of all the GSOCseq products in alphabetical order. Each product should include the ISO 3166-1 alpha-3 country code in its name. For instance, in the case of Turkey, ISO_GSOCseq_AbsDiff_BAU_Map030 should be changed to TUR_GSOCseq_AbsDiff_BAU_Map030.
All 29 products must be georeferenced TIF (.tif) files.
Table 16.1 Overview of the 29 GSOCseq Products
Step 2 Check the projection and resolution of all products
Open the products in QGIS or any other preferred GIS platform. Check that the projection of all products is EPSG:4326 - WGS 84 (Layer properties). Check that the spatial resolution (pixel size) (Layer properties) is equal to ~0.00833 degrees ; 1 km x 1km at the equator.
Step 3 Check that the products were generated for agricultural and grazing areas only
Visualize the 29 products in QGIS or any preferred GIS platform. Load a land-use layer to visually assess that the simulations were done exclusively on agricultural areas.
Step 4 Check for units, range, and outliers
In the following section expected value ranges for each product category are presented. It is important to note that the provided ranges represent a gross approximation of what can be normally expected when running the proposed methodology. Results that fall outside these ranges and that did not occur due to common issues presented in the section 15.2 need to be carefully evaluated based on local expertise and available literature.
The provided ranges can be compared in QGIS, R, or any preferred platform. Descriptive layer statistics can be viewed in QGIS under Layer Properties in the Information tab (Figure 16.2).
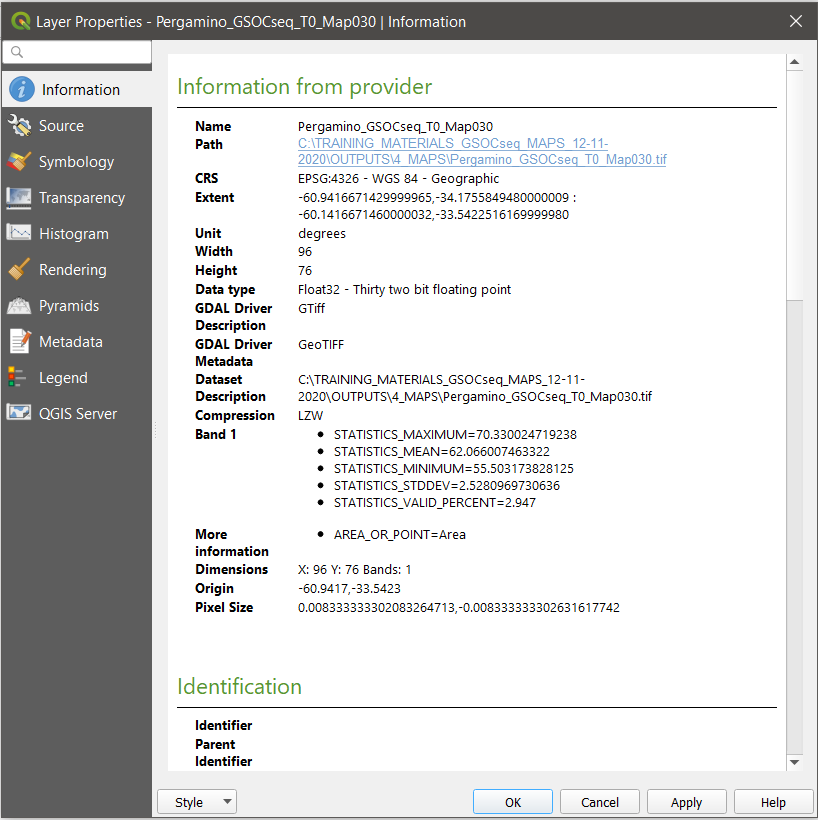
Figure 16.2 Layer statistics in QGIS
Soil Organic Carbon at T0 (2020)
The product ISO_GSOCseq_T0_Map030 refers to the SOC stocks 0-30 cm in t/ha used as input in the Forward phase.
Check statistics of ISO_GSOCseq_T0_Map030 file. The provided reference values may vary for each country depending on external factors that need to be carefully evaluated. However, the following values can be generally expected:
- Most of the values should fall between 15-100 t/ha
- Minimum values should be greater than 0 (except for -999 Values, which indicate no data values)
- -999 values should be masked out
- There should not be negative values other than -999
- Maximum values should not exceed 800 t/ha.
Final SOC stocks after 20 simulation years for all scenarios (BAU, SSM1, SSM2, SSM3)
These products refer to the SOC stocks 0-30 cm in t/ha at the end of the forward phase simulations for the 4 scenarios (BAU, SSM1, SSM2, SSM3).
Check the statistics of:
- ISO_GSOCseq_finalSOC_BAU_Map030
- ISO_GSOCseq_finalSOC_SSM1_Map030
- ISO_GSOCseq_finalSOC_SSM2_Map030
- ISO_GSOCseq_finalSOC_SSM3_Map030
The provided reference values may vary for each country depending on external factors that need to be carefully evaluated. However, the following values can be generally expected:
- Most of the values should fall between 15-100 t/ha
- Minimum values should be greater than 0 (except for -999 Values, which indicate no data values)
- -999 values should be masked out
- There should not be negative values other than -999
- Maximum values should not exceed 800 t/ha.
- Mean values SOC SSM3 > SSM 2 > SSM 1 > BAU
Absolute differences in SOC stocks
The layers showing the absolute differences in SOC stocks refer to the SOC change 0-30 cm in t/ha (Final SOC stocks vs initial stocks T0) for the BAU, SSM1, SSM2, and SSM3 scenarios.
Check the statistics of:
- ISO_GSOCseq_AbsDiff_BAU_Map030
- ISO_GSOCseq_AbsDiff_SSM1_Map030
- ISO_GSOCseq_AbsDiff_SSM2_Map030
- ISO_GSOCseq_AbsDiff_SSM3_Map030
The provided reference values may vary for each country depending on external factors that need to be carefully evaluated. However, the following values can be generally expected:
- The expected range should fall usually between -80 to +80 t/ha (with an approximate average of -15 to +15)
- Negative values can occur and indicate SOC losses between 2020 and 2040 (-999 indicate no data values).
- -999 values should be masked out
- Negative values other than -999 values should usually not exceed -80
- Maximum values should usually not exceed +80
- Check if extreme values (values > +80 and values < -80) are grouped or dispersed (refer to Annex I, Common errors and considerations)
- Mean values in order of size SSM3 > SSM 2 > SSM 1 > BAU
Relative differences in SOC stocks
These products refer to the SOC change 0-30 cm in t/ha (Final SOC stocks in SSM scenarios vs Final stocks BAU scenario) for the SSM1, SSM2, and SSM3 scenarios.
Check the statistics of:
- ISO_GSOCseq_RelDiff_SSM1_Map030
- ISO_GSOCseq_RelDiff_SSM2_Map030
- ISO_GSOCseq_RelDiff_SSM3_Map030
The provided reference values may vary for each country depending on external factors that need to be carefully evaluated. However, the following values can be generally expected:
- Expected range usually falls between 0 to +80 t/ha
- -999 values should be masked out
- There should not be negative values other than -999
- Maximum values should usually not exceed +80
- Check if extreme values (values > +80) are grouped or dispersed (refer to Annex I, Common errors and considerations)
- Mean values SSM3 > SSM 2 > SSM 1
Absolute sequestration rates (ASR)
Absolute sequestration rates (ASR) refer to the SOC change rate 0-30 cm in t/ha/yr (Final SOC stocks vs initial stocks T0 divided by 20 years) for the BAU, SSM1, SSM2, and SSM3 scenarios.
Check the statistics of:
- ISO_GSOCseq_ASR_BAU_Map030
- ISO_GSOCseq_ASR_SSM1_Map030
- ISO_GSOCseq_ASR_SSM2_Map030
- ISO_GSOCseq_ASR_SSM3_Map030
The provided reference values may vary for each country depending on external factors that need to be carefully evaluated. However, the following values can be generally expected:
- The expected range for all maps should fall between -4 to +4 t/ha
- ASR BAU: usually most values from -0.5 to + 0.5, with median values near 0 or lower
- ASR SSM1: usually most values -0.4 to + 0.6, with median near 0 or higher (similar to BAU)
- ASR SSM2: usually most values -0.3 to + 0.7
- ASR SSM3: usually most values -0.2 to + 0.8
- -999 and -49.95 Values (-999/20) indicate no data values. Values <= -49.95 should be masked out
- Negative values other than -999 and -49.95 (meaning SOC losses between 2020 and 2040) should not exceed -4
- Maximum values should usually not exceed +4.
- Check if extreme values (> +4; <-4) are grouped or dispersed (refer to Annex I, Common errors and considerations)
- Mean values SSM3 > SSM 2 > SSM 1 > BAU
Relative sequestration rates (RSR)
Relative sequestration rates refer to the SOC change rate 0-30 cm in t/ha/yr (Final SOC stocks under SSM vs Final stocks BAU divided by 20 years) for the SSM1, SSM2, and SSM3 scenarios, compared to BAU scenario.
Check the statistics of:
- ISO_GSOCseq_RSR_SSM1_Map030
- ISO_GSOCseq_RSR_SSM2_Map030
- ISO_GSOCseq_RSR_SSM3_Map030
The provided reference values may vary for each country depending on external factors that need to be carefully evaluated. However, the following values can be generally expected:
- The expected range should fall between 0 to +4 t C/ha (with most data being distributed between 0 to +1)
- RSR SSM1: usually most values range from 0 to + 0.6, with median near 0 or higher (similar to BAU)
- RSR SSM2: usually most values range from 0 to + 0.7
- RSR SSM3: usually most values range 0 to + 0.8
- -999 and -49.95 Values (-999/20) indicate no data values. Values <= -49.95 will be excluded from Global product
- There should not be negative values other than -999 and -49.95:
- Check if grouped or dispersed (refer to Annex I)
- Maximum values should usually not exceed +4.
- Check if grouped or dispersed (refer to Annex I)
- Mean SOC values in order of size SSM3 > SSM 2 > SSM 1
Uncertainties
Check the statistics of:
- ISO_GSOCseq_ASR_BAU_UncertaintyMap030
- ISO_GSOCseq_ASR_SSM1_UncertaintyMap030
- ISO_GSOCseq_ASR_SSM2_UncertaintyMap030
- ISO_GSOCseq_ASR_SSM3_UncertaintyMap030
- ISO_GSOCseq_BAU_UncertaintyMap030
- ISO_GSOCseq_RSR_SSM1_UncertaintyMap030
- ISO_GSOCseq_RSR_SSM2_UncertaintyMap030
- ISO_GSOCseq_RSR_SSM3_UncertaintyMap030
- ISO_GSOCseq_SSM_UncertaintyMap030
- ISO_GSOCseq_T0_UncertaintyMap030
The provided reference values may vary for each country depending on external factors that need to be carefully evaluated. However, the following values can be generally expected:
- Expected range all maps, usually between 0 to +200 % (most data generally between 15 to 50%)
- -999 indicates no data values. Negative values and -999 values should be masked out
- Maximum values should usually not exceed +200%.
- Check if extreme values (>200 % and <0 %) are grouped or dispersed (refer to Annex I, Common errors and considerations)