 Soil Sampling Design
Chapter 2 Setting-up the software environment
This chapter provides an overview on the software required to set-up a soil sampling design. The tools are open source and can be downloaded and installed by users following the steps that are described here.
2.1 Use of R, RStudio and R Packages
R is a language and environment for statistical computing created in 1992. It provides a wide variety of statistical (e.g. linear modelling, statistical tests, time-series, classification, clustering, etc.) and graphical methods, and has been constantly extended by an exceptionally active user community.
2.1.1 Obtaining and installing R
Installation files and instructions can be downloaded from the Comprehensive R Archive Network (CRAN).
- Go to the following link https://cran.r-project.org/ to download and install R.
- Pick an installation file for your operational system.
- Choose the “base” distribution of R (particularly if it is the first time you install R).
- Download the R installation file and open the file on your device.
- Follow the installation instructions.
2.1.2 Obtaining and installing RStudio
Beginners will find it very hard to start using R because it has no Graphical User Interface (GUI). There are some GUIs which offer some of the functionality of R. RStudio makes R easier to use. It includes a code editor, debugging and visualization tools. Similar steps need to be followed to install RStudio.
- Go to https://www.rstudio.com/products/rstudio/download/ to download and install RStudio’s open source edition.
- On the download page, RStudio Desktop, Open Source License option should be selected.
- Pick an installation file for your platform.
- Follow the installation instruction on your local device.
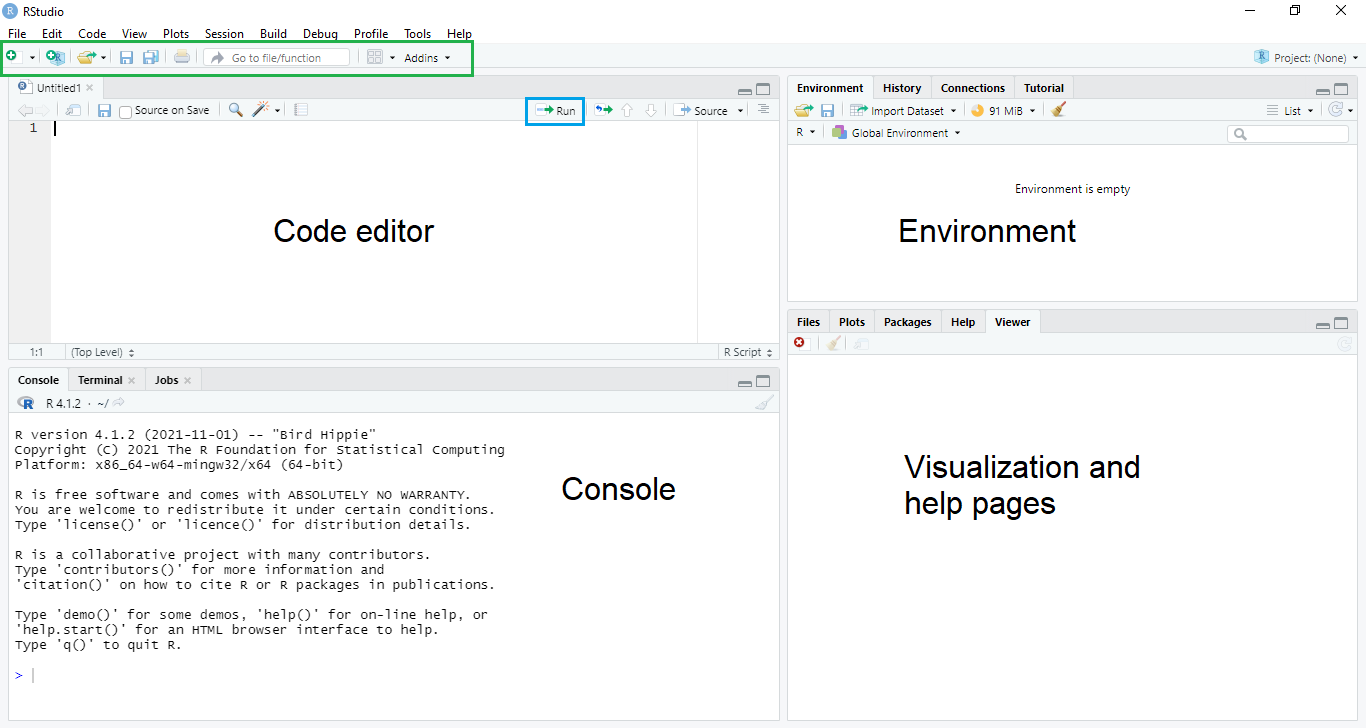
Figure 2.1: R Studio interface.
The RStudio interface is structured by four compartments (see Fig. 2.1). The code editor is located in the upper left. Scripts that contain codes are displayed here. New scripts can be opened by clicking on the left most New button in the quick access tool bar (highlighted in green). Lines of code can be executed by clicking on Run (highlighted in blue) or by pressing ctrl + enter on your keyboard. The output of scripts or lines of code that are executed is displayed in the window below the code editor: the console (bottom left). This part of the interface corresponds to the R software that were installed previously. When working in R, it is central to work with so-called objects (for instance vectors, dataframes or matrices). These objects are saved in the global environment that is displayed in the top right panel. Finally, the R software offers a broad range of powerful tools for visualisation purposes. Graphs or maps that are generated by scripts/codes, are displayed in the bottom right panel.
2.1.3 Getting started with R
- R manuals: http://cran.r-project.org/manuals.html
- Contributed documentation: http://cran.r-project.org/other-docs.html
- Quick-R: http://www.statmethods.net/index.html
- Stackoverflow R community: https://stackoverflow.com/questions/tagged/r
2.2 R packages
When you download R, you get the basic R system which implements the R language. R becomes more useful with the large collection of packages that extend the basic functionality of it. R packages are developed by the R community.
refer to: * tidyverse book (R for data science) * caret (broad range of statistical learning functions) * R spatial: https://rspatial.org/ (R packages for spatial data operations)
The primary source for R packages is CRAN’s official website, where currently about 20,250 available packages are listed. For spatial applications, various packages are available. You can obtain information about the available packages directly on CRAN with the ‘available.packages()’ function. The function returns a matrix of details corresponding to packages currently available at one or more repositories. An easier way to browse the list of packages is using the Task Views link, which groups together packages related to a given topic.
Packages come along with extensive documentation that is very helpful to understand and solve error messages. To access information on functions or packages, type “?[Package or Function name]” or “??[Package or Function name]” in the console. The information on the package and/or function can then be accessed in the bottom right panel under “Help” (see Fig. 2.1). In addition to that, the R documentation website (https://www.rdocumentation.org/) provides more extensive help and gives clear overviews on all functions comprised in a certain package.
2.3 GEE - google earth engine
Google earth engine (GEE) provides a large range of remote sensing datasets for users. It allows to use the GEE code editor to run computations using the Google servers. The high computational power of these servers enables users with limited computational capacities to run complex calculations. A user account must be created to use the code editor. This step can take some time. Once the account is validated, scripts can be written in the code editor using the Javascript language. An extensive array of instructions and guides are available on the platform. Alternatively, the Python language can be used to interact with the data.
The code editor interface is structured by three panels and a map viewer (see Fig. 2.2). The left panel is structured in “Scripts”, “Docs”, and “Assets”. Under “Scripts” users can organize and save the scripts they wrote for specific purposes. “Docs” provides further information on so-called “server-side” functions that can be used to manipulate the data. Finally, in “Assets” users can upload own spatial data in common formats such as shapefiles (.shp) or raster files (.tif). The middle panel contains the scripts that can be run by clicking on the “Run” button. The right panel is composed of three functionalities. The “Inspector” provides basic information on a pixel of a layer displayed in the map below. The information consists of longitude, latitude, and - if layers are loaded - values of the pixel. The “Console” is the place where certain commands expressed in the code are shown. The most common expressions shown here are print() commands or figures derived from the loaded data. Finally, the “Tasks” button shows all tasks that were formulated in the code/script and are to be submitted to the server for computation. Once a task is submitted, the user has to click on the “Run” button appearing in the “Tasks” section to submit the task to the server. In addition to that, the data catalogue can be accessed via the search bar on the top of the page. Here, key information on the available datasets, origin, resolution and related publications can be found.
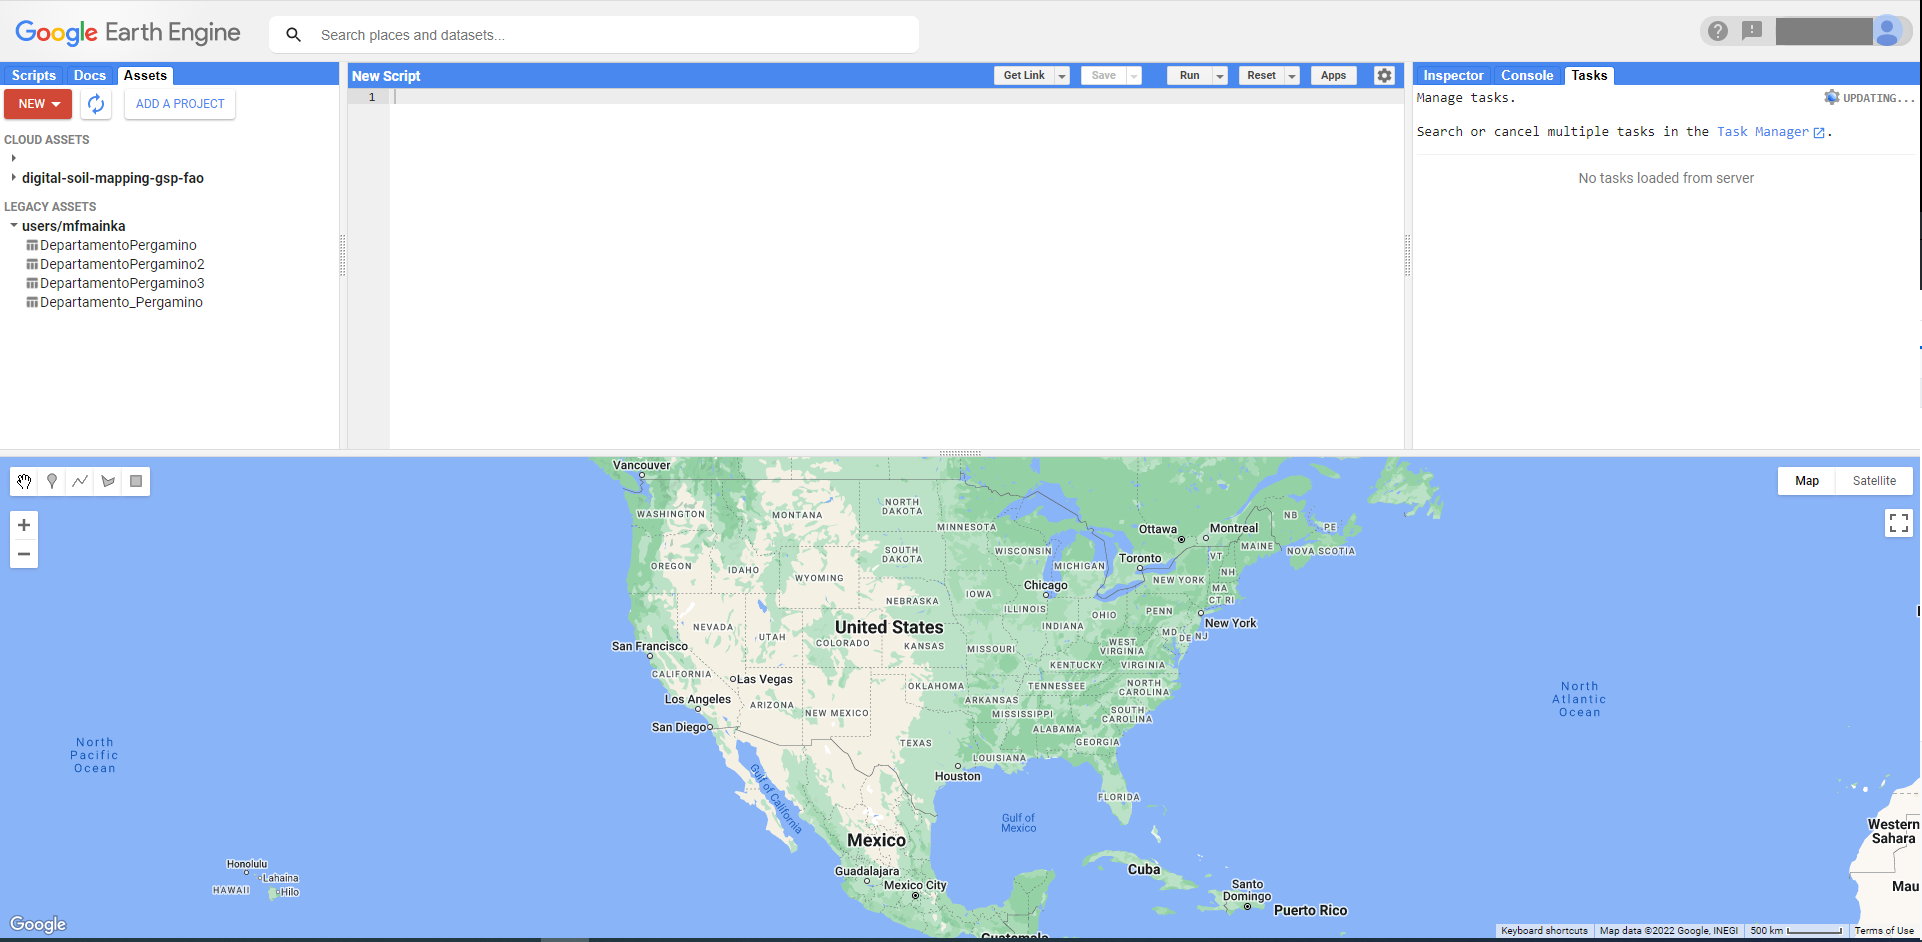
Figure 2.2: Google Earth Engine code editor.