 Global Soil Nutrient and Nutrient Budgets maps (GSNmap) Phase I
Chapter 4 Digital Soil Mapping
4.1 Principles
Digital soil mapping (DSM) is a methodological framework to create soil attribute maps on the basis of the quantitative relationships between spatial soil databases and environmental covariates. The quantitative relations can be modelled by different statistical approaches, most of them considered machine learning techniques. Environmental covariates are spatially explicit proxies of soil-forming factors that are employed as predictors of the geographical distribution of soil properties. The methodology has evolved from the theories of soil genesis developed by Dokuchaev (1883) in his work the Russian Chernozems, which later were formalised by Jenny (1941) with the equation of the soil-forming factors. The conceptual equation of soil-forming factors has been updated by McBratney, Santos and Minasny (2003) as follow:
\[\begin{equation} S = f\left(s,c,o,r,p,a,n\right) \tag{4.1} \end{equation}\]
Where \(S\) is the soil classes or attributes (to be modelled) as a function of “\(s\)” as other soil properties, “\(c\)” as climatic properties, “\(o\)” as organisms, including land cover and human activity, “\(r\)” as terrain attributes, “\(p\)” as parent material, “\(a\)” as soil age, and “\(n\)” as the geographic position.
4.2 Covariates
Covariates are geospatially referenced parameters that constitute pivotal determinants within the domain of digital soil mapping. Covariates encapsulate the underlying drivers shaping soil variability, aiding in the prediction of soil properties across landscapes. These variables consist of a diverse range of factors, including topography, vegetation, climate variables, and land use information among others. Careful selection of relevant covariates is essential, as their choice directly impacts the accuracy of soil property predictions.
4.3 Machine learning techniques
A broad range of modelling approaches exist in order to establish quantitative relationships between environmental covariates and the target soil properties to be mapped. Traditionally, multiple linear regression models can be used to quantify the relationships which continues to be the most applied mapping method to map for instance soil organic carbon (Lamichhane, Kumar and Wilson, 2019). In addition to that, regression Kriging methods combine linear regressions and an stochastic interpolation of the regression residuals based on their spatial autocorrelation (Yigini et al., 2018). However, machine learning algorithms with more flexible assumptions, i.e. non-linear relationships, have become more and more popular as the mapping performance was substantially improved and the versatility of the algorithms can be detect more complex relationships. Among the most commonly used non-linear machine learning models is random forest (Breiman, 2001). The random forest algorithm splits a dataset into subsets and uses a random selection of covariates (predictors) to identify homogeneous groups. The procedure of classifying is repeated many times and in the end the prediction is averaged. Traditional random forests output the mean prediction from the random trees. Quantile regression forests (QRF) is an extension of random forests developed by Nicolai Meinshausen (Meinshausen, 2006) that provides non-parametric estimates of the median predicted value as well as prediction quantiles. The benefit of QRF is the ability to predict not only the mean of the prediction but also to provide more information on the uncertainty and probability distribution.
4.4 Mapping of soil nutrients and associated soil attributes
DSM has been used to produce maps of soil nutrients at regional to continental scales. For instance, Hengl et al. (2017) predicted 15 soil nutrients at a 250 m resolution in Africa using a random forest model (Wright, Ziegler and König, 2016). The soil nutrient observations were collected for topsoils at locations that were unevenly distributed over the continent and a set of spatially-explicit environmental covariates including soil properties. In 2021, the map resolution was increased to 30 x 30 m by using additional soil samples (Hengl et al., 2021). In Europe maps of chemical soil properties, including macronutrients like potassium and phosphorus, were mapped based on a gaussian process regression using the LUCAS soil database (Ballabio et al., 2019). Global efforts to map soil nutrients in a harmonised way are hampered by the limited availability of appropriate soil data. The country-driven approach of the GSP can potentially overcome this limitation by fostering and leveraging national expertise. To implement the GSP’s country-driven global mapping exercise, this Technical Manual provides step-by-step guidelines to map soil nutrients and associated properties using georeferenced soil observations following a digital soil mapping approach using the quantile regression forest algorithm (Figure 4.1).
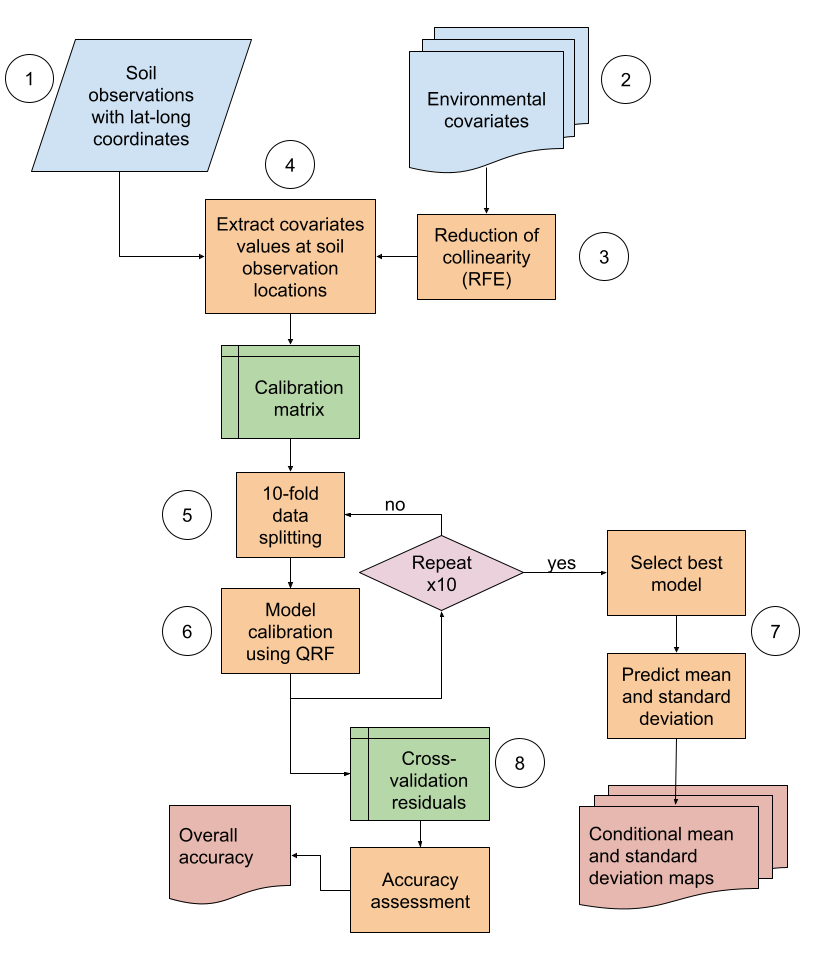
Figure 4.1: Digital soil mapping approach for the GSNmap Phase I. Circles are the steps.