Characteristics of salt-affected soils
Genesis of salt-affected soils
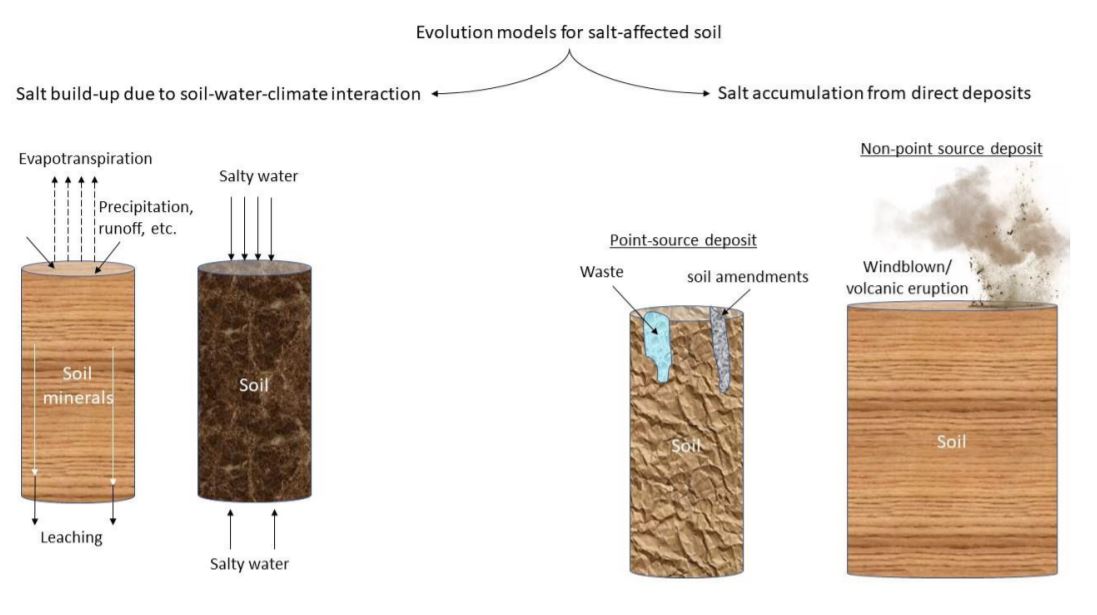
The minerals responsible for salt problems in the soil originate from diverse sources and gradually accumulate to contribute to the formation of salt-affected soils. Many models exist in the literature for describing the salt accumulation and evolution of these soils. They can be grouped into two broad categories (Figure 2.1): one involving climatic interactions with soil and water (Miller and Brierley, 2011) and the other describing direct deposit of the salt particles into the soil (Abou-Baker and El-Dardiry, 2015; Daliakopoulos et al., 2016).
Soils-water-climate interaction mode
This model was first proposed by Gedroiz (Kelly and Brown, 1934) and described the evolution of salt- affected soils along the trajectory of gradual changes of the characteristics of soluble salts. It postulated that salt-affected soils develop when dissolved minerals in water accumulate and change status as water is moved from the soil. Soluble salts are deposited in the soil when water evaporates and gradually accumulate with time to form saline soils. Sodic soils then develop when the soluble salts are leached and/or when divalent cations are precipitated out of the exchange complex followed by the corresponding increase in sodium ions. If leaching is insufficient, the salt-affected soils remain predominantly saline (FAO, 1984). Further types of sodic soils (e.g. solodized sodic soils) are formed when sodium ions move out of the exchange complex and are replaced by hydrogen ions (Miller and Pawluk, 1994). This genetic evolution is common in arid and semiarid areas where evaporative demand is high during certain times of the year.
Salt-affected soils also develop when salts accumulate due to repeated direct contact of soil with salty water. In this case, the type of salt-affected soils is particularly influenced by the dominant soluble salts in the salty water (Munn and Boehm, 1983). The model describing this genetic pathway is common in the coastal areas and in areas with salty and high groundwater table. The model also explains the development of certain types of salt-affected soils or ion-specific salinity in areas subjected to wastewater irrigation (Jalali et al., 2008).
Direct deposit model
In this model, salt accumulation in the soil is facilitated by the repeated deposition of salt particles or solutions in the soil. There are two types of this model: point-source and non-point source deposits (Figure 2.1). Point-source depositions introduce localized salt accumulation, which gradually spread to other areas or down the soil profile by action of runoff, leaching, tillage, etc. Non-point deposits occur when windblown salt particles or volcanic eruptions settle on the soil. Alternate layers of the deposits may be buried and contribute to accumulation of salts in the soil profile. This model also explains the development of salt-affected soils due to geologic marine incursions (Schofield et al., 2001).
Characteristics
The dominant cations in salt-affected soils are Sodium (Na+), Calcium (Ca2+), Magnesium (Mg2+), Potassium (K+) and dominant anions are Chloride (Cl-), Sulphate (SO-2), Carbonate (CO-2), Bicarbonate (HCO-) and Nitrates (NO-) (Richards, 1954). Salt-affected soils with high amounts of sodium ions are known as sodic soils. High content of sodium ions in these soils cause dispersion of clay and organic matter, which settle on the surfaces of soil particles to give them a brownish black appearance. This black appearance is the reason for the name “black alkali soils” in reference to sodic soils (Richards, 1954). When the dispersed clay settles in between soil particles, they plug the matric spaces and block water infiltration. Consequently, sodic soils tend to remain waterlogged for extended period after rainfall or irrigation. In some instances, dispersed humus and clay may be leached down the soil profile and portray clay accumulation and decrease in texture down the profile (Sparks, 2003; Krasilnikov et al., 2013).
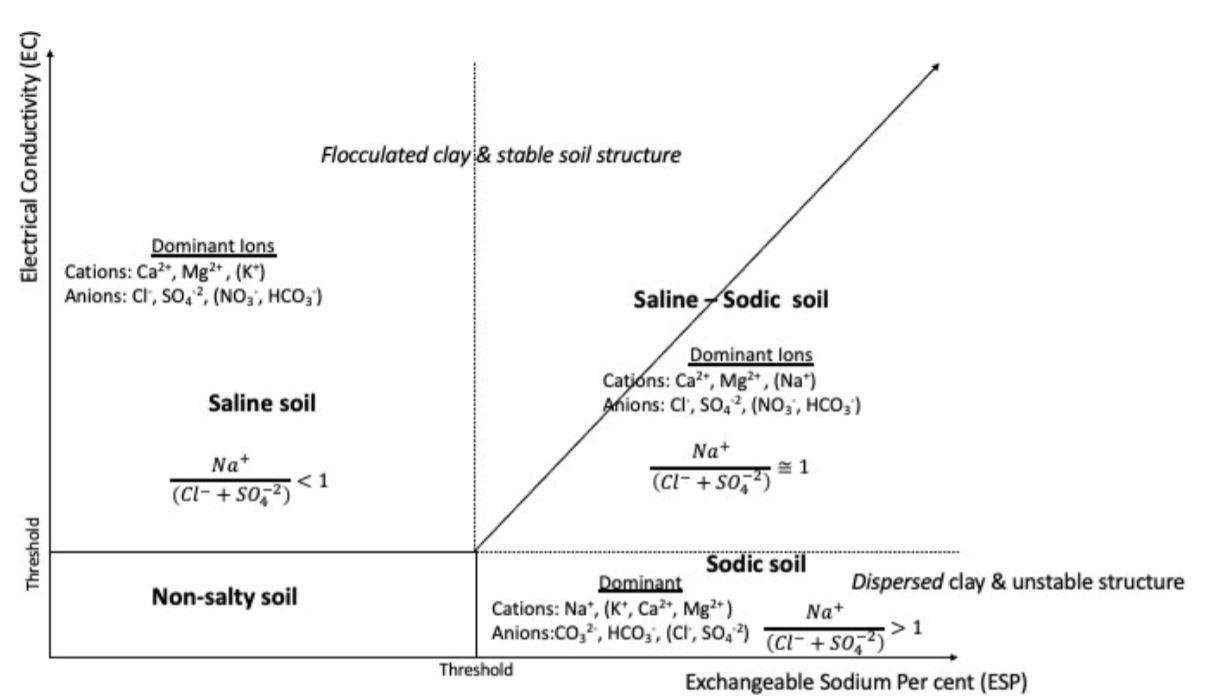
High content of sodium ions has been used as an indicator for identifying sodic soils. According to Richards (1954), sodium occupies more than 15% of the soil’s cation exchange capacity (CEC) in sodic soils. This observation has led to the use of Exchangeable Sodium Percent (ESP) \(\geq\) 15 as a diagnostic indicator for sodic soils. In addition, since sodic soils are low in total salt but high in exchangeable sodium, the ratio of sodium ions to the sum of major anions has been shown to be more than 1 in sodic soils (Chhabra, 2005). Figure 2.2 gives an illustration of the characteristics of sodic soils.
Salt-affected soils with high contents of soluble salts and low sodium ions in the exchange complex are often identified as saline soils. Due to their low content of exchangeable sodium ions, saline soils have low ESP and the ratio between sodium ions and sum of major anions is less than 1 (Figure 2.2). Preponderance of chloride and sulphate ions give saline soils a brownish white appearance. Hence, they are sometimes referred to as white alkali soils.
Saline soils with significant proportions of calcium ions have good soil structure. Calcium ions have high flocculation power in the soil (Sumner and Naidu, 1998; Rangesamy and Marchuk, 2011). Therefore, their presence in soil tends to promote clay flocculation and particle aggregation. Some saline soils have gypsum (calcium sulphate) and lime (calcium and magnesium carbonate) (Skarie et al., 1987).
Salt-affected soils with high content of soluble ions and appreciable amount of sodium ions are known as saline-sodic soils. When sodium salts in these soils hydrolyse, the pH of the soil increases and the soil changes to sodic soils. In this regard, saline-sodic soils are sometimes referred to as saline-soils capable of alkaline hydrolysis (Chhabra, 2005). When the soluble salts remain high in the saline-sodic soils, the characteristics of the soils are like those of the saline soils. When the concentration of the soluble salts is lowered and the sodium salts hydrolyse, then the characteristics of the soils change to those of sodic soils.
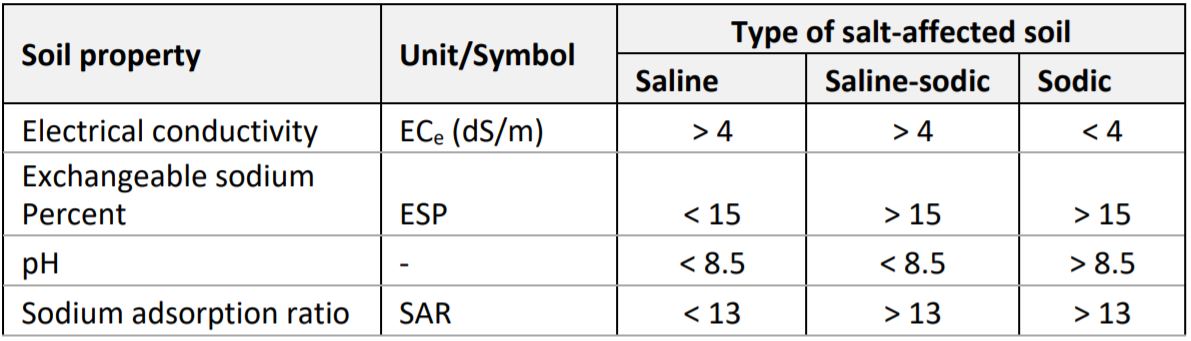
Richard (1954) used measurable soil properties to further quantify characteristics of salt-affected soils (Table 2.1). These characteristics have been widely applied for general classification of salt-affected soils (Chhabra, 2005; Zaman et al., 2018).
Table 2.1: Characteristics of salt-affected soils
Indicators for assessing salt-affected soils
Indicators of salt-affected soils are features that identify the status or occurrence of the soils. In this book, they have been divided into three categories: quantitative soil properties, qualitative soil surface/profile properties, and vegetation characteristics.
Quantitative soil indicators are measurable soil properties related to salt problems in the soil such as concentration of soluble ions or exchangeable sodium ions, soil pH, etc. Integral soil indicators representing overall concentration of soil salts are also often used. These indicators include electrical conductivity (EC), total soluble salts (TSS), total dissolved solids (TDS), total soluble cations (TSC), resistivity etc. (Abrol et al., 1988; Zaman et al., 2018). Various levels of these indicators have been proposed in the literature for identification of the three types of salt-affected soils. A seminal work in this regard was proposed by Richard (1954) (Table 2.1). Other adjustments to the thresholds given in Table 2.1 have since been given, for example using different levels of soil pH and introduction of the ratio of soluble ions (Table 2.2). Soil spectral reflectance indices are also new indicators under development and are expected to provide diagnostic threshold for different types of salt-affected soils (Kalra and Joshi, 1994; Farifteh et al., 2008).
Table 2.2: Summary of soil properties for diagnosing salt-affected soil
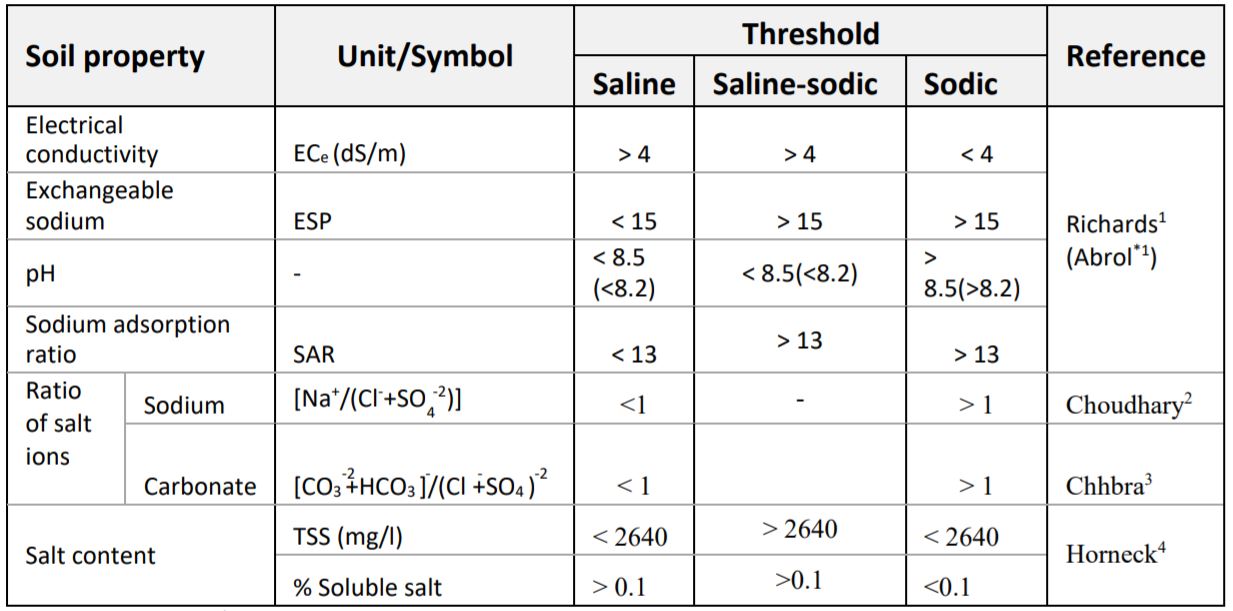 1 Richards (1954); 1 Abrol et al. (1988); 2Choudhary and Kharche (2018); 3Chhabra (2005); 4Horneck et al. (2007)
Qualitative soil properties are observable features associated with certain characteristics of salt-affected
soils. They include presence of crusts, qualitative diagnostic properties of natric/salic soil horizons, columnar/prismatic soil structure under dry conditions with peds covered by brownish black films (WRB,
2014; Pankova, 2015). These soil properties are mostly used to identify salt-affected soils in the field.
Their aggregate evidence can be found in most soil maps with delineations of salt-affected soils (Abuelgasim and Ammad, 2019). Salt-tolerant vegetation are dominant in salt-affected areas. Their presence is sometimes used as indicator of salt-affected soil (Bouchhima et al., 2018). An advance application of this concept is found in remote sensing of the earth surface. Many tests have revealed correlation between remote sensing indices with salt-affected soils (Gorji et al., 2019).
Drivers of salt problems in the soil
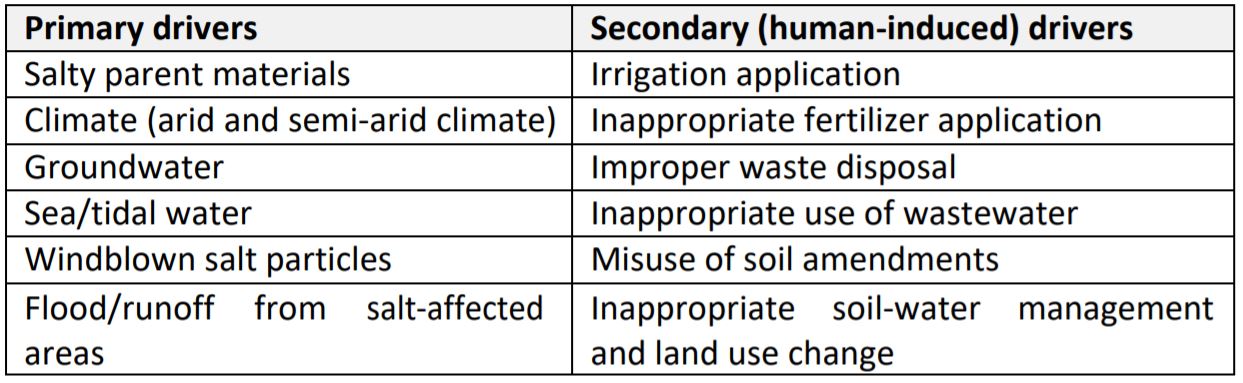
Drivers of salt problems in the soils can be grouped into two: primary and secondary drivers. Primary drivers are the natural sources of mineral elements contributing to the salt problems or the natural conditions that favor development of salt-affected soils. Secondary drivers are factors that exacerbate salt problems in the soils. They are largely associated with human intervention on the natural environment. Table 2.3 gives a summary of these drivers of salt problems in the soil.
Table 2.3: Drivers of salt problems in soil
Primary drivers
Salty parent material is a primary source of salt problems in the soil. They gradually release the mineral constituents of soil during chemical weathering, which react with air and water to produce soluble salts responsible for salt problems. These salts are laterally carried away by moving water to other sites or
vertically by capillarity up the soil profile (Fanning and Fanning, 1989). Further processes such as leaching can convert the salt conditions to produce other types of salt-affected soils.
Climate is another driver of formation of salt-affected soils. In arid and semi-arid climate, the evaporative demand dries up water on the soil which leave the salt crystals on the soil surface. In addition, low rainfall in these climatic zones does not fully facilitate leaching of salts down the soil profile. The combined effects of evaporative demand and insufficient leaching cause accumulation of salts in the soil and contribute to the development of salt-affected soils (Schaetzl and Anderson, 2005).
Groundwater is another driver influencing the development of salt-affected soils. Salty groundwater rising through the soil profile by capillarity contributes the salts, which remain in the soil when the water evaporates (Rengasamy, 2006). In certain areas where salty groundwater table meets the land surface, groundwater is discharged on to the soil surface as springs and geysers. The discharged salty water gradually builds salts in the soil and contribute to the development of salt problems in the soil. Groundwater also contributes to the salt problems when its salty water is used for irrigation.
Other primary causes of salt problems in the soils are sea/tidal water interaction, windblown salt deposits, and salty runoff water. Sea/tidal water contains salt that remain on the soil after interaction with soil at the seacoast. They can also influence soil salt problems when the water is used for irrigation or if used elsewhere (such as in wastewater or sewage) but later discharged onto the soil. Interaction of windblown salt particles also introduces salts into soils. Repeated deposits of windblown salt particles can accumulate the salts and lead to the development of salt-affected soils (Yang et al., 2018). Recurrent runoff or flood water from salt-affected areas can also bring in salt, which can accumulate with time and contribute to the development of salt-affected soils (Krasilnikov et al., 2013).
Secondary drivers
Irrigation is the most cited secondary driver of salt problems in the soil. Irrigation water can either induce salt problems when salty water is used for irrigation or when irrigation water causes inadequate leaching of soil salts. Irrigation water can also recharge groundwater and cause it to rise and gradually introduce groundwater salts into the soil (Rietz and Haynes, 2003; Pulido-Bosch et al., 2018). Fertilized irrigation water can also introduce salts into the soil, which gradually build up with repeated application and contribute to the development of salt-affected soils.
Besides irrigation, waste and wastewater are also significant secondary drivers of salt problems in the soil. Improper management of wastewater and solid waste can contribute to the development of salt-affected soils (Piotr, 2008). Repeated disposal of waste material either directly mix with soil or contribute salty leachates into the soil, which gradually accumulate with time and lead to the formation of salt-affected soils. Use of wastewater in irrigation is also another way of inducing salt problem in the soil. Wastewaters contain mineral elements which can cause ion-specific toxicity and salinity in the soil (Muyen et al., 2011; Abd-Elwahed, 2018).
Land use/cover change is also an important secondary driver of salt-accumulation in the soil. Altering the vegetation type in certain ecosystems potentially change the plant water-use and evapotranspiration characteristics with consequences such as drying up of soil and salt build-up. Changing the vegetation types can also alter the equilibrium of groundwater table and eventually contribute to groundwater-induced salt-affected soils (Rengasamy, 2006). In the arid and semi-arid environments, declining vegetation cover has also been linked to increased exposure of soils to the risk of salinization (Perri et al., 2018).
Other secondary sources of salt problems in the soil include inappropriate fertilizer application, inadequate drainage, and misuse of soil amendments.
Classification of salt-affected soils
Salt-affected soils are classified according to the types of salt and intensity of the salt problems. Classification of the types of salt-affected soils was first proposed by Richard (1954) based on electrical conductivity (EC), pH and exchangeable sodium percent (ESP) or sodium adsorption ratio (SAR). According to this scheme, there are three types of salt-affected soils (Table 2.2):
- Saline: soils with excess soluble salts in which EC > 4 dS/m, pH < 8.5, and ESP < 15 (or SAR < 13)
- Sodic: soils with excess exchangeable sodium ions in which EC<4 dS/m, pH>8.5, and ESP>15 (SAR>13)
- Saline-sodic soils: soils with high content of soluble salts and appreciable quantity of sodium ions capable of alkaline hydrolysis. The soils have EC>4 dS/m, pH < 8.5 and ESP >15 (or SAR > 13)
Many proposals have been proposed in the literature on the limits given by Richards (1954). Abrol et al. (1988) proposed pH limit of 8.2 instead of 8.5 for the three classes of salt-affected soils. This pH value was also found satisfactory in Indian soils (Choudhary and Kharche, 2018). Szabolcs (1987) also gave a further classification of saline soils as: Gypsiferous soils, saline soils due to calcium chloride, saline soils due to soluble magnesium salts, acid sulphate soils with iron and aluminium sulphates, and potentially saline soils.
Classification of the intensity of salt problems in the soil is commonly expressed using levels of electrical conductivity and exchangeable sodium ions and on weight basis (Richard, 1954; Abrol et al., 1988; FAO, 2006; Chinese Academy of Sciences, 2001). Examples of these levels are given in Table 2.4
Table 2.4: Identifying intensity of salt problems in soil
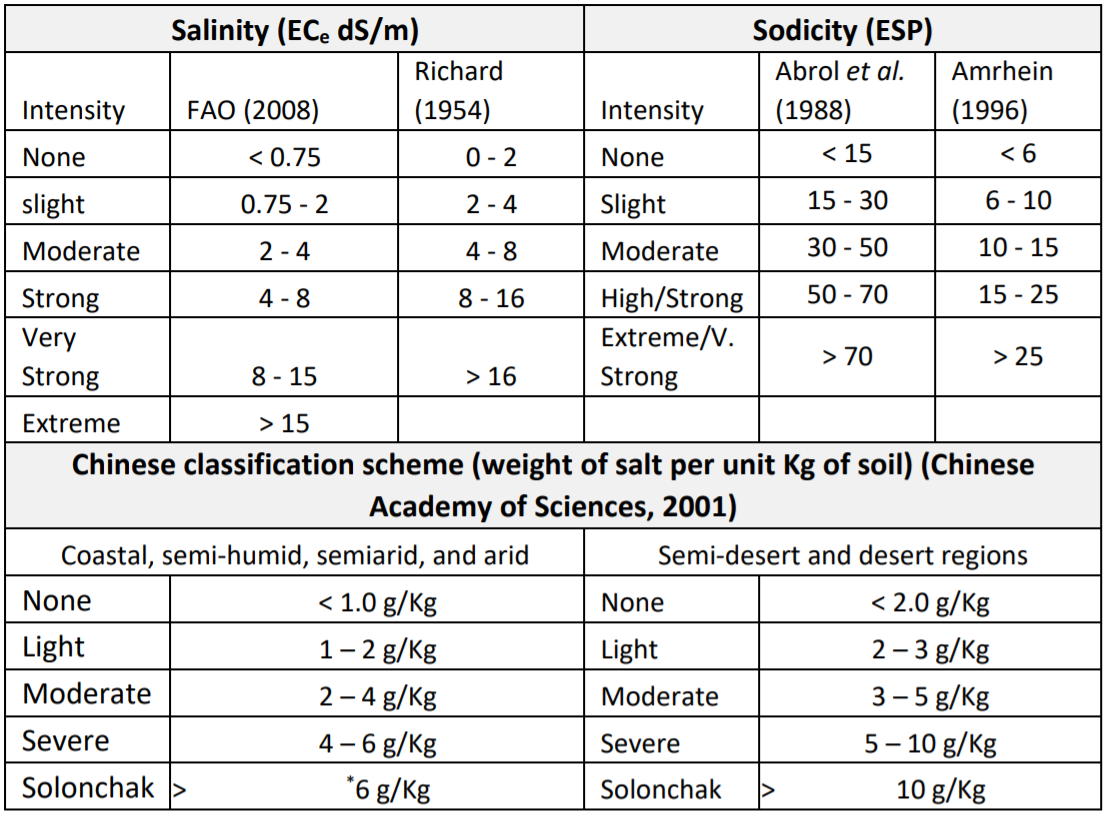
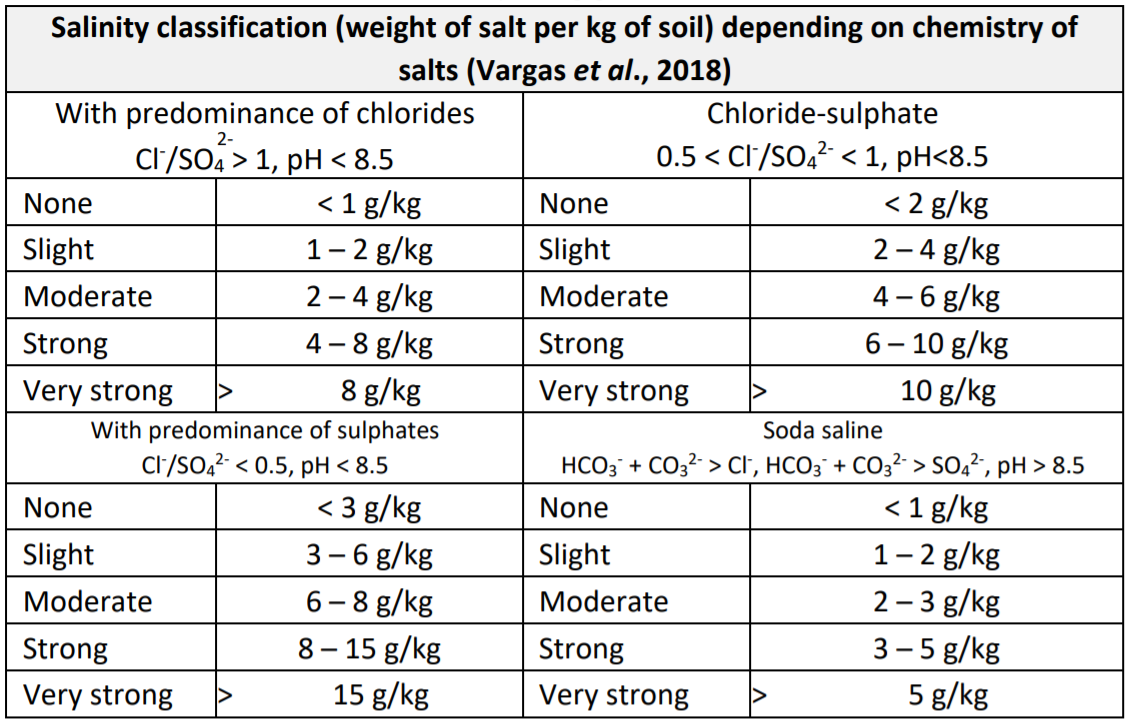
Besides the classification in Table 2.4, there are some other lumped parameters that are used to assess the salinity problems. The parameters include total dissolved solids (TDS in mg/L), total soluble cations (TSC) and total soluble anions (TSA) in mol(c)/L. There are approximations in the literature for converting these gravimetric measures into EC. For example, TDS may be approximated by multiplying EC (dS/m) by 800 for hypersaline soils and 640 for other saline soils. These are approximate guidelines since there are no exact relationships. Classification of salt intensity using gravimetric measurements has been given by Vargas et al. (2018) (Table 2.5).
The classification schemes in Table 2.4 and Table 2.5 show that there are many alternatives for identifying different levels of salt problems. They can be used at the national scale in the countries where they are popularly used.
Table 2.5: Classification of salt intensity using gravimetric measurements
Global distribution of salt-affected soil
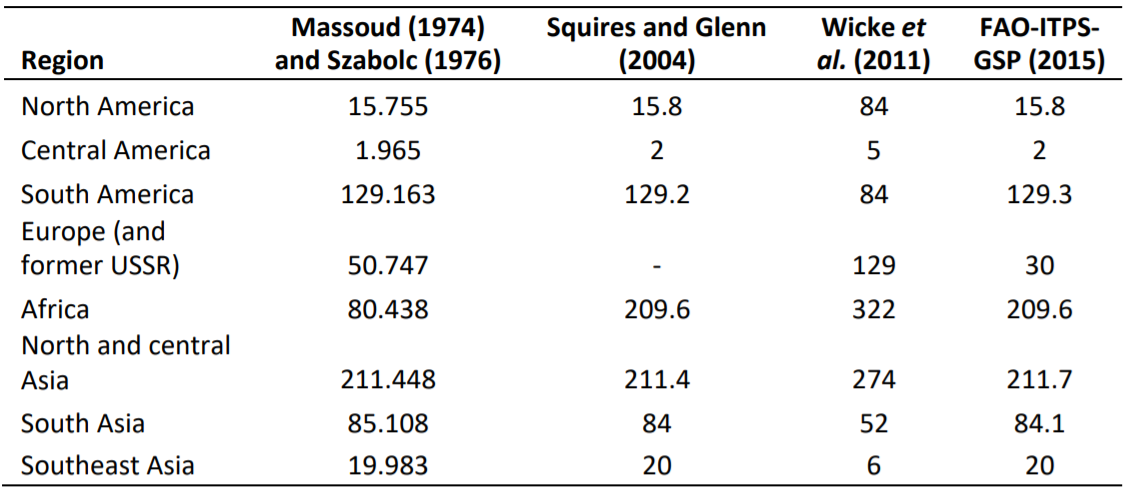
Salt-affected soils are found in all continents in varying spatial proportions. The literature is replete with attempts to quantify the global distribution of these soils. Massoud (1976) and Szabolcs (1979) developed the first world map of salt-affected soils using FAO/UNESCO Soil Map of the World. They estimated salt- affected areas at about 0.9 billion hectares (Table 2.6). In 2004, Squires and Glenn (2004) published new estimates of the global distribution and placed the coverage of affected areas at 1.029 billion hectares. This estimate portrayed 40% of the global affected areas as saline and 60% as sodic soils.
Table 2.6: Global estimates of salt-affected areas
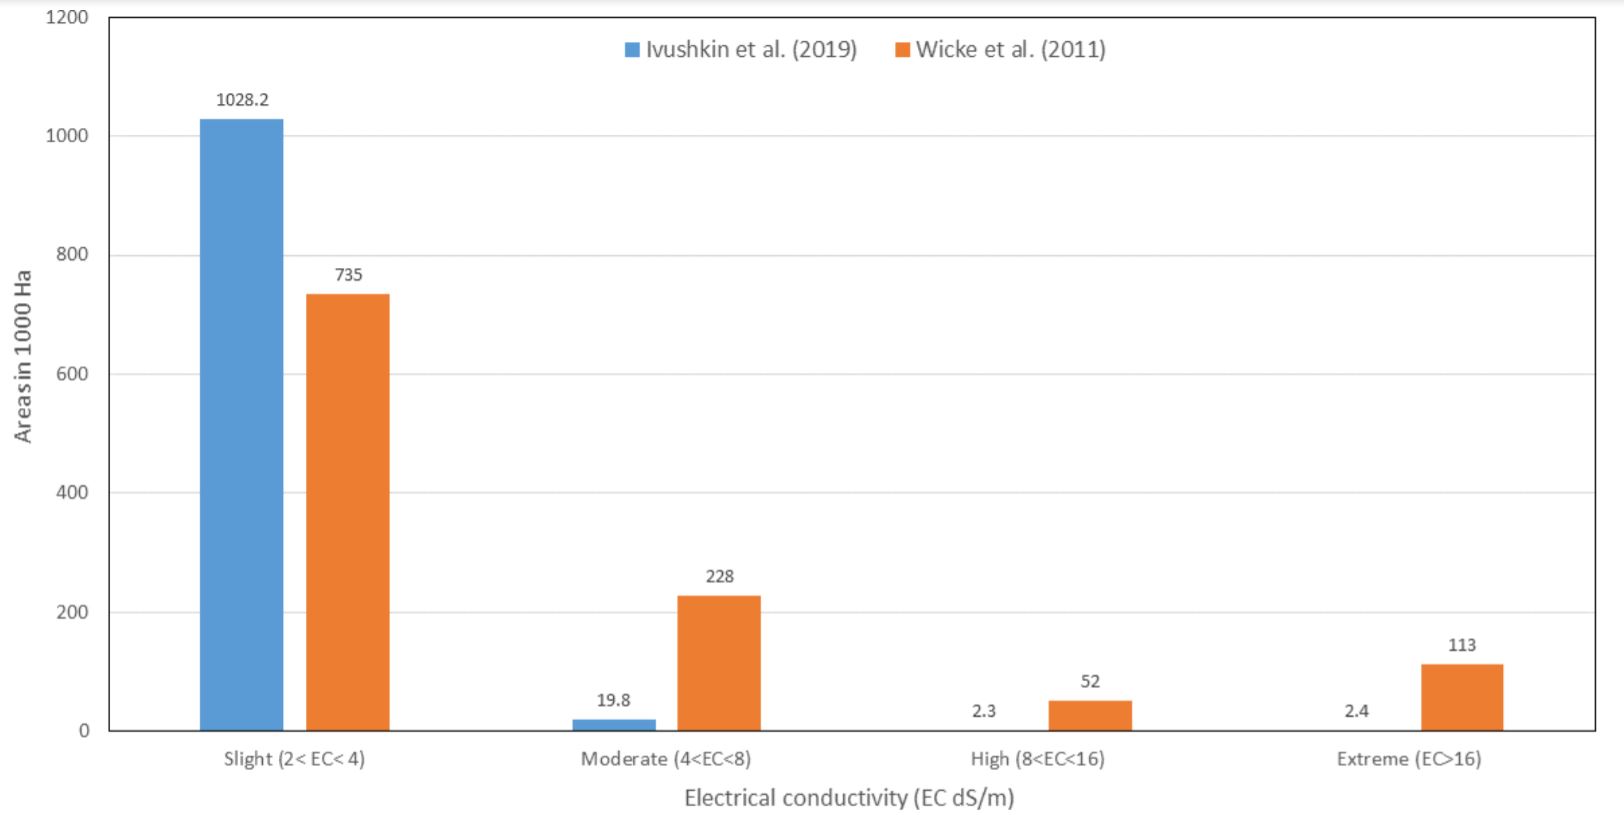
In 2011, Wicke et al. (2011) estimated the global distribution of types and intensity of salt-affected soils based on the Harmonized World Soil Database (FAO et al., 2008). Their estimate portrayed salt-affected areas as covering 1.1 billion hectares in which 60% of the areas were saline, 26% sodic, and 14% saline- sodic (Figure 2.3). It is important to note the proportions of affected areas by types as given by Wicke et al. (2011) was the opposite (flipped) proportions given by Squires and Glenn (2004). In 2018, Joint Research Centre (JRC) developed a global map of salinization, which showed the affected areas covering 1 billion hectares (Cherlet et al., 2018).
Recently, Ivushkin et al. (2019) published another global estimate of salt-affected soils. This study used a combination of remote sensing, soil data from World Soil Information System (WoSIS, https://www.isric.org/explore/wosis) and modelling. Their estimate also put the global distribution of salt- affected soils at about 1 billion hectares (Figure 2.3).
Interestingly, all these global estimates have remained nearly the same at around 1 billion hectares. Possible explanations are that: 1) the overall salt-affected soil areas have not changed over the years, or
2) the input data for estimating the areas has not changed, or 3) the estimation methods have been inconsistent. There is a need for new updates to improve the global information of the status of salt- affected soils.
Although all continents have salt-affected soils, arid and semi-arid Land (ASAL) areas seem to have a higher proportion. This is attributed to the prevalently low and irregular rainfall and high evaporative demand in ASAL areas, which all together combine to accumulate salts in/on the soil (Sheng et al., 2010; Pankova and Konyushkova, 2013).
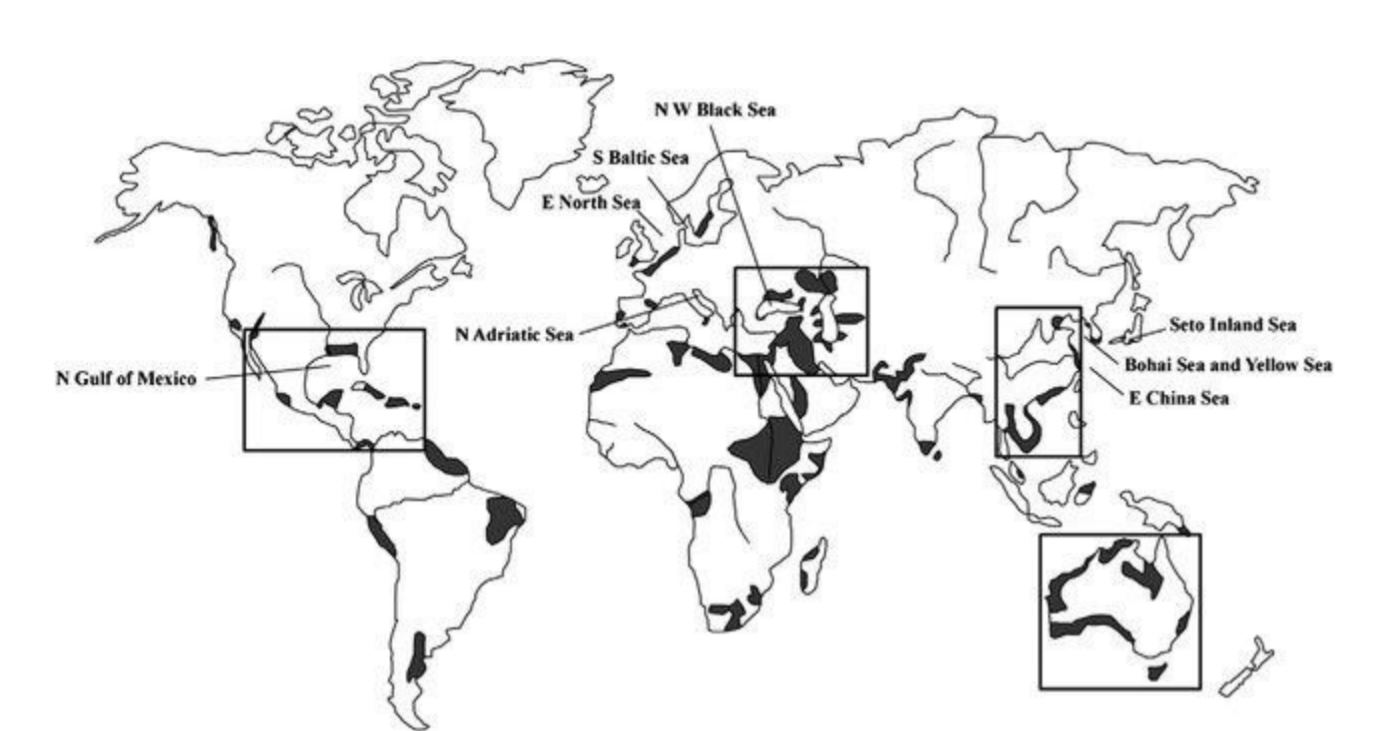
Apart from ASALs, coastline salt problems are also of significant importance. Coastline salt problems are largely due to seawater intrusion. Li et al. (2014) gave a global picture of salt-affected coastlines of the world using secondary information from the literature (Figure 2.4). Other than this preliminary work, there is no clear data or representation of the extent and severity of salt-affected coastlines of the world.